Connecting energy and data
Top-Bottom Spreads
A top-bottom spread compares high and low prices within a selected period. Time resolution and the number of charging and discharging hours determine the result. A spread is not net battery revenue: losses, costs and physical constraints also matter.
Updated 22 October 2026
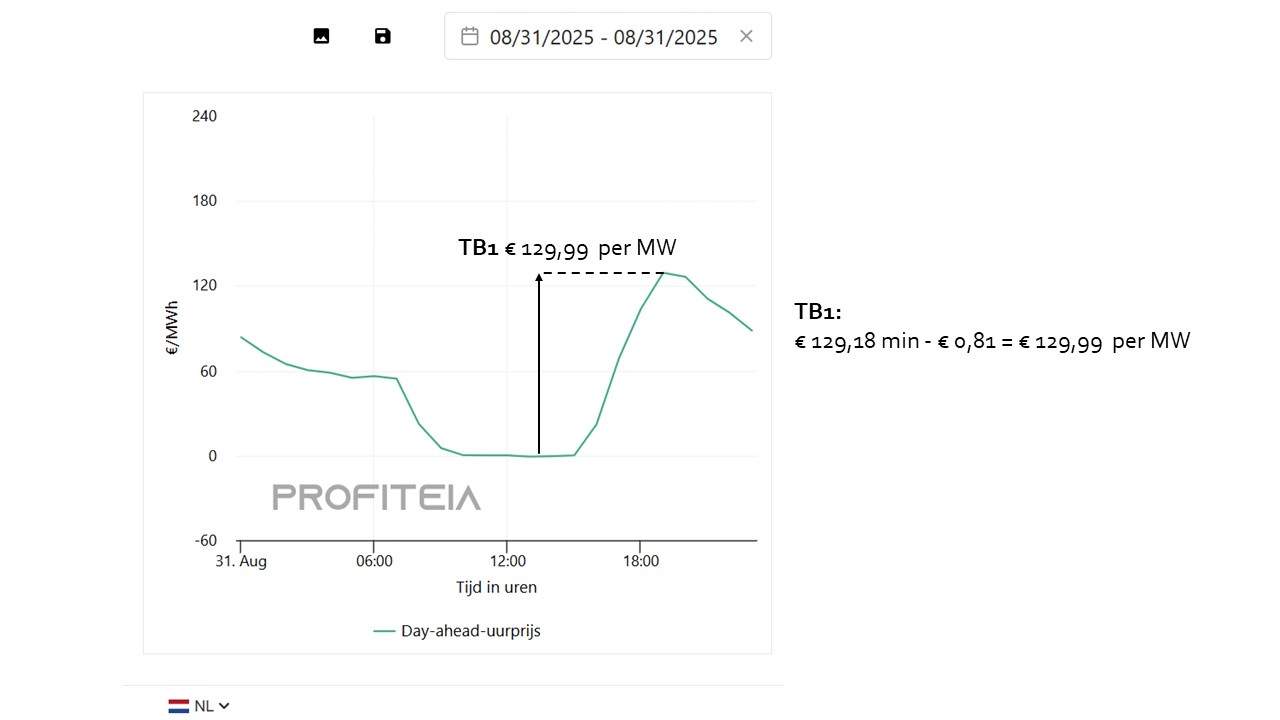
What are TB spreads? TB spreads (Top-Bottom spreads) measure the difference between the highest and lowest market prices within a day. They provide direct insight into arbitrage potential – especially for batteries, flexible assets, and other dispatchable capacity.
There are several variants:
TB1: highest 1-minute price minus lowest price of the day.
TB2/TB4: sum of the 2 or 4 highest hourly prices minus the 2 or 4 lowest.
Important: TB spreads are indicative, not direct revenue. They provide an upper bound on earning potential but do not account for efficiency losses, imbalance costs, or market constraints.
Why are TB spreads so important? 1. Volatility as a revenue model Price differences are increasing. Heatwaves, storm peaks, and reduced market coupling regularly cause spreads of > €400/MW. Where chaos arises, opportunity lies.
2. From balancing income to arbitrage Balancing markets are becoming saturated. The focus shifts to the spot market. TB spreads thus become the new anchor point for flexibility revenues.
3. Operational risks under control Systems are vulnerable: a failing market coupling mechanism (such as SDAC decoupling) can increase price fluctuations. TB spreads act as an early warning signal.
Development in the Netherlands Dutch TB spreads are rising structurally – except for 2022 (due to gas price dominance). Recent averages (source: ENTSO-E day-ahead, NL):
Type 2025 (Jan–Aug) 2024 2023 TB1 €136 €136 €113 TB2 €254 €255 €211 TB4 €444 €446 €363
The annual averages for 2025 are at the same level as 2024 – but the distribution per quarter is fundamentally different:
Quarter Q1 Q2 Q3 (Jul–Aug) 2024 €66 €122 €147 2025 €116 €163 €127
Q1 2025 has nearly doubled compared to Q1 2024 (+76%). The winter months are becoming structurally more volatile – a direct result of the increasing weather dependency of the electricity system. Q2 2025 continued the trend with +34%.
The most extreme day in 2025: 1 July 2025 with a TB1 spread of €477/MWh. On that day, the price differences between peak and off-peak exceeded all previous records.
Other markets such as Germany, Belgium, and France also show significantly varying spreads, depending on their production mix and grid structure.
Strategic relevance for investors For financiers, project developers, and asset managers, TB spreads offer:
Proxy for revenue modelling (including P50/P90)
Benchmark between countries/locations
Insight into storage duration optimisation
Support for valuation and financing
In short: TB spreads help translate uncertainty into investable certainty.
Profiteia’s role: insight and action
Profiteia has fully integrated TB spreads into its platform:
Choose Base for news and monitoring, Pro for forecasts and advanced analysis, or Enterprise for tailored agreements. Prices are per user per month.
This information seamlessly complements our other insights, such as imbalance alerts, bidding strategy simulations, and control state predictors.
How to use TB spreads as a control variable 1. Link to real-time data Combine TB spreads with imbalance prices, grid impact, and system state (RT1/RT2).
2. Choose the right TB type per cycle Do you have 1 cycle per day? Use TB1. Two cycles? TB4.
3. Manage your risks Use TB as an early warning for market disruptions or unexpected price spikes.
4. Model your value stack Use TB scenarios combined with P50/P90 for bidding strategies, asset planning, and financing.
5. Benchmark internationally Compare locations on spread potential – a better gauge than average price alone.
6. Integrate with your dispatch logic Let your battery charge/discharge smartly based on TB triggers, forecasts, and live market signals.
Ready to use TB spreads strategically? Profiteia reports TB spreads every week. Standard for the Netherlands, and each week we also show other countries in the ‘TB spread’ newsletter. You can sign up here: https://profiteia.io/tb-spreads/
Choose Base for news and monitoring, Pro for forecasts and advanced analysis, or Enterprise for tailored agreements. Prices are per user per month.
Profiteia offers tools, data, and expertise to optimise your asset’s performance. Request a demo or activate TB spread monitoring in your dashboard.
Always the first energy insight
Subscribe to our newsletter and receive current market information, smart insights, and updates about our platform. Short, relevant, and directly applicable.
Top-Bottom Spreads TB-spreads – the difference between peak and off-peak prices on the energy market – are rapidly evolving from niche indicators to indispensable control variables… Read more →
Imbalance In the dynamic energy market, imbalance is the playing field for profit and risk. Profiteia offers real-time, validated insights and smart forecasts… Read more →
Flexibility and batteries Flexibility is the key to profit in an energy market full of sun, wind and data. Profiteia helps you with real-time insights… Read more →
Sources and terminology
Check the source and the conditions for the relevant country and market product.
Connecting energy and data
Experience Profiteia yourself.
Discover which data and tools support your work. Try the demos.